Cadastre and land use
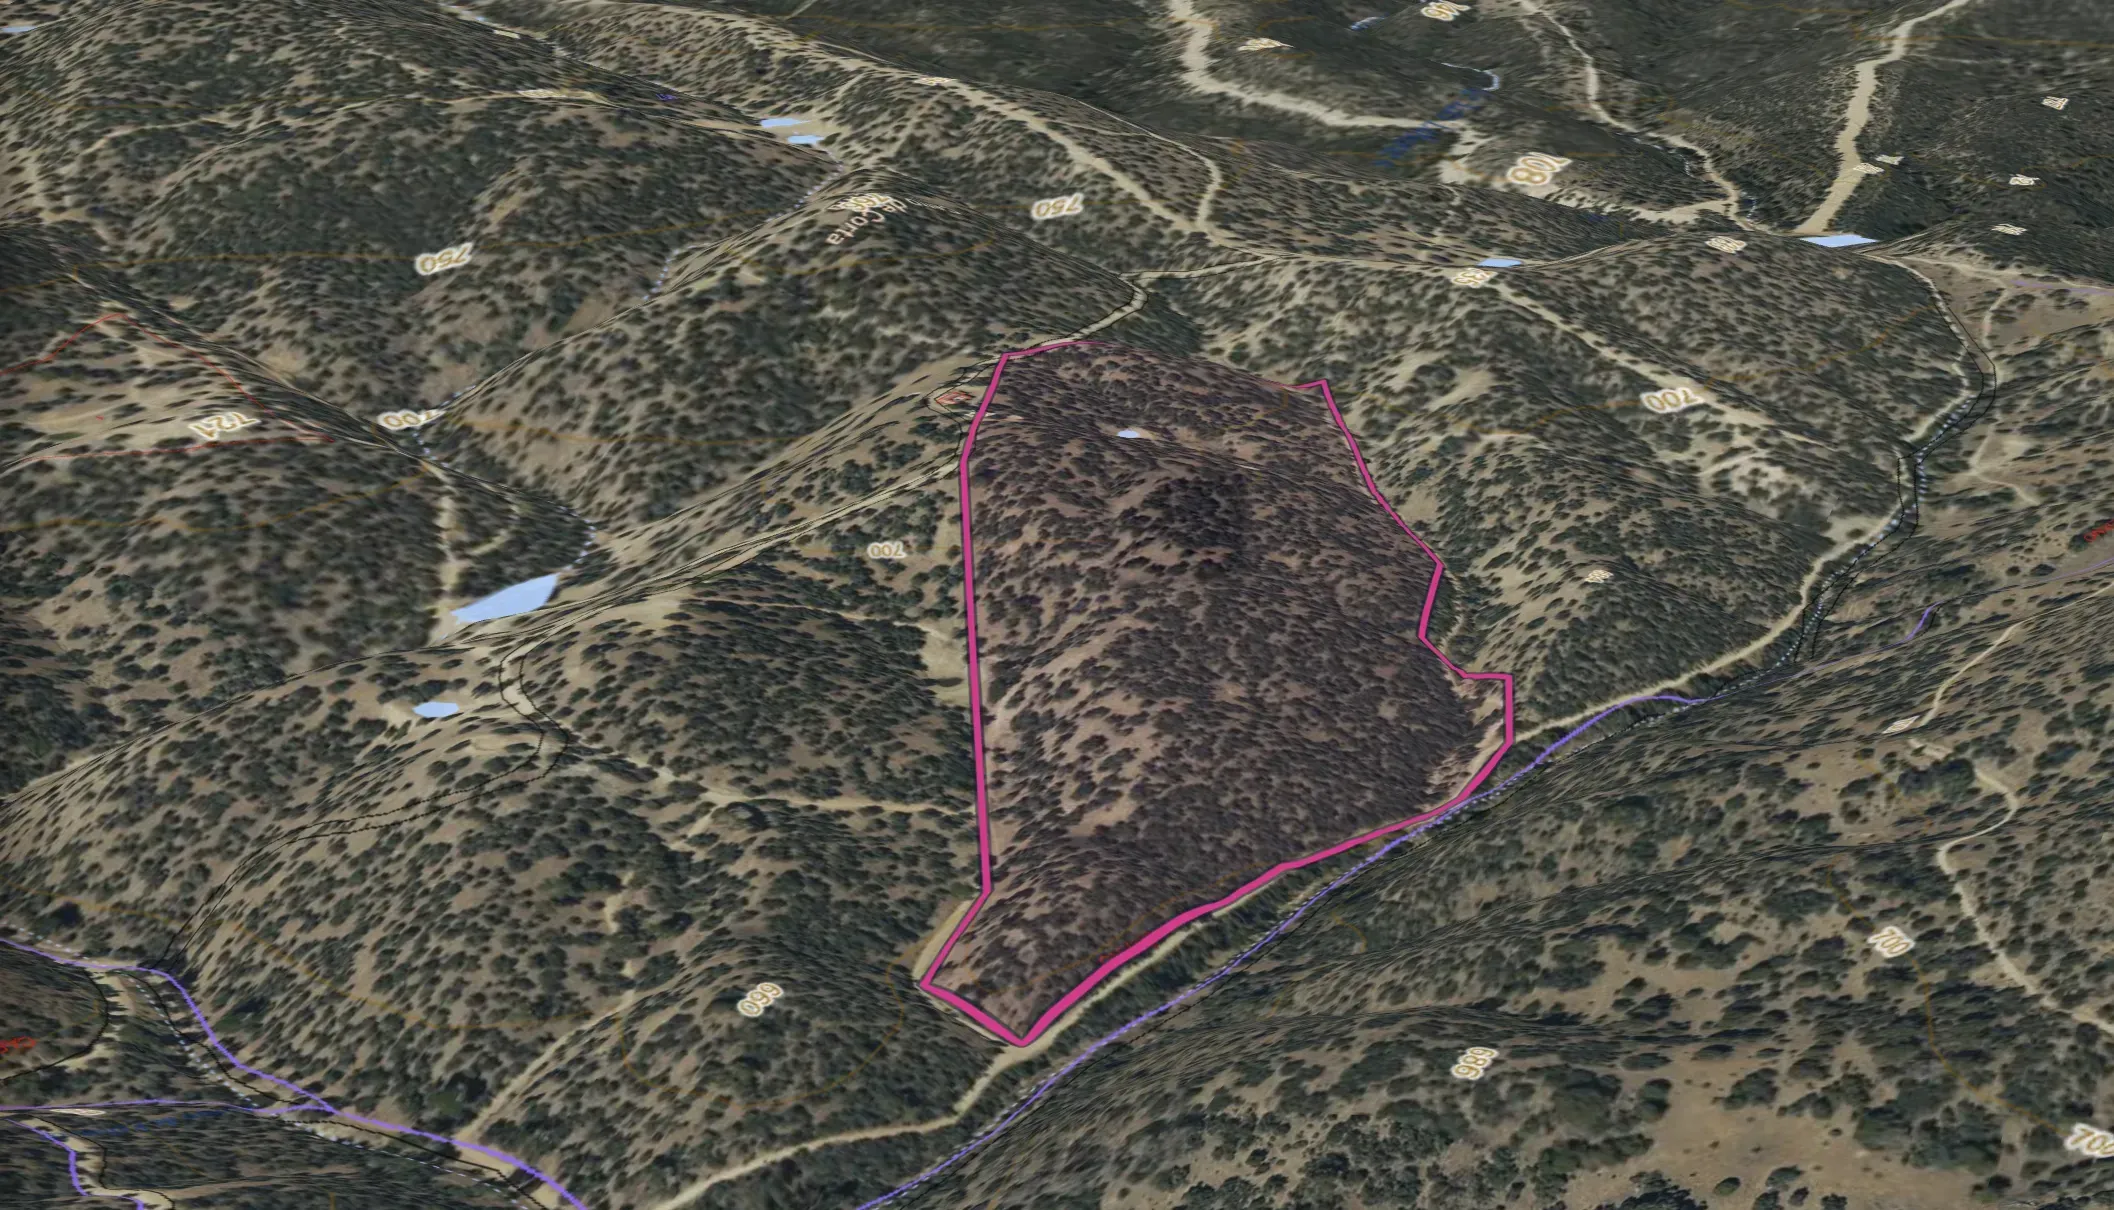
Plots, administrative boundaries and land use, with the cadastral reference of every plot.
SENDA
The geospatial viewer that brings together the official layers for your territory and turns them into a clear report to plan its adaptation to climate change.
SENDA view · PNOA © IGN · Copernicus DEM
Land intelligence
Plots, administrative boundaries and land use, with the cadastral reference of every plot.
Contour lines, river network, water bodies and water balance.
Geology, hydrogeology, habitats and protected areas.
Wildfire, flooding and other natural hazards, layer by layer.
How it works
01
Search by cadastral reference or draw the area in the viewer.
02
SENDA connects each agency's official layers with your field data.
03
Terrain, climate, water, soil and biodiversity, chapter by chapter, in 2D or 3D.
04
A summary and a downloadable report, with the source of every data point.
Adaptation
SENDA combines climate, water, soil and land use across your territory to plan its adaptation with official data.
Climate series and water balance for your area, so you know what water you can count on.
The state of the soil, its uses and its vegetation cover, as a starting point.
Wildfire and flooding, layer by layer, to prioritise where to act.
How the territory has changed, with historical aerial imagery from other years.
For public administrations, land and natural area managers, and farming and forestry businesses.
From each agency's live official layers, such as the Spanish Cadastre, IGN or AEMET, completed with your field data. Every data point shows its source.
Yes. It works the same for a single plot as for an entire municipality.
Yes. SENDA documents the soil and its carbon to prepare carbon removal projects under ISO 14064-2 and track them year after year.
Your territory in a 2D and 3D viewer and a downloadable report by chapter, with a summary to support decisions.
Tell us about the territory you manage, however small, and we will show you what its data says.
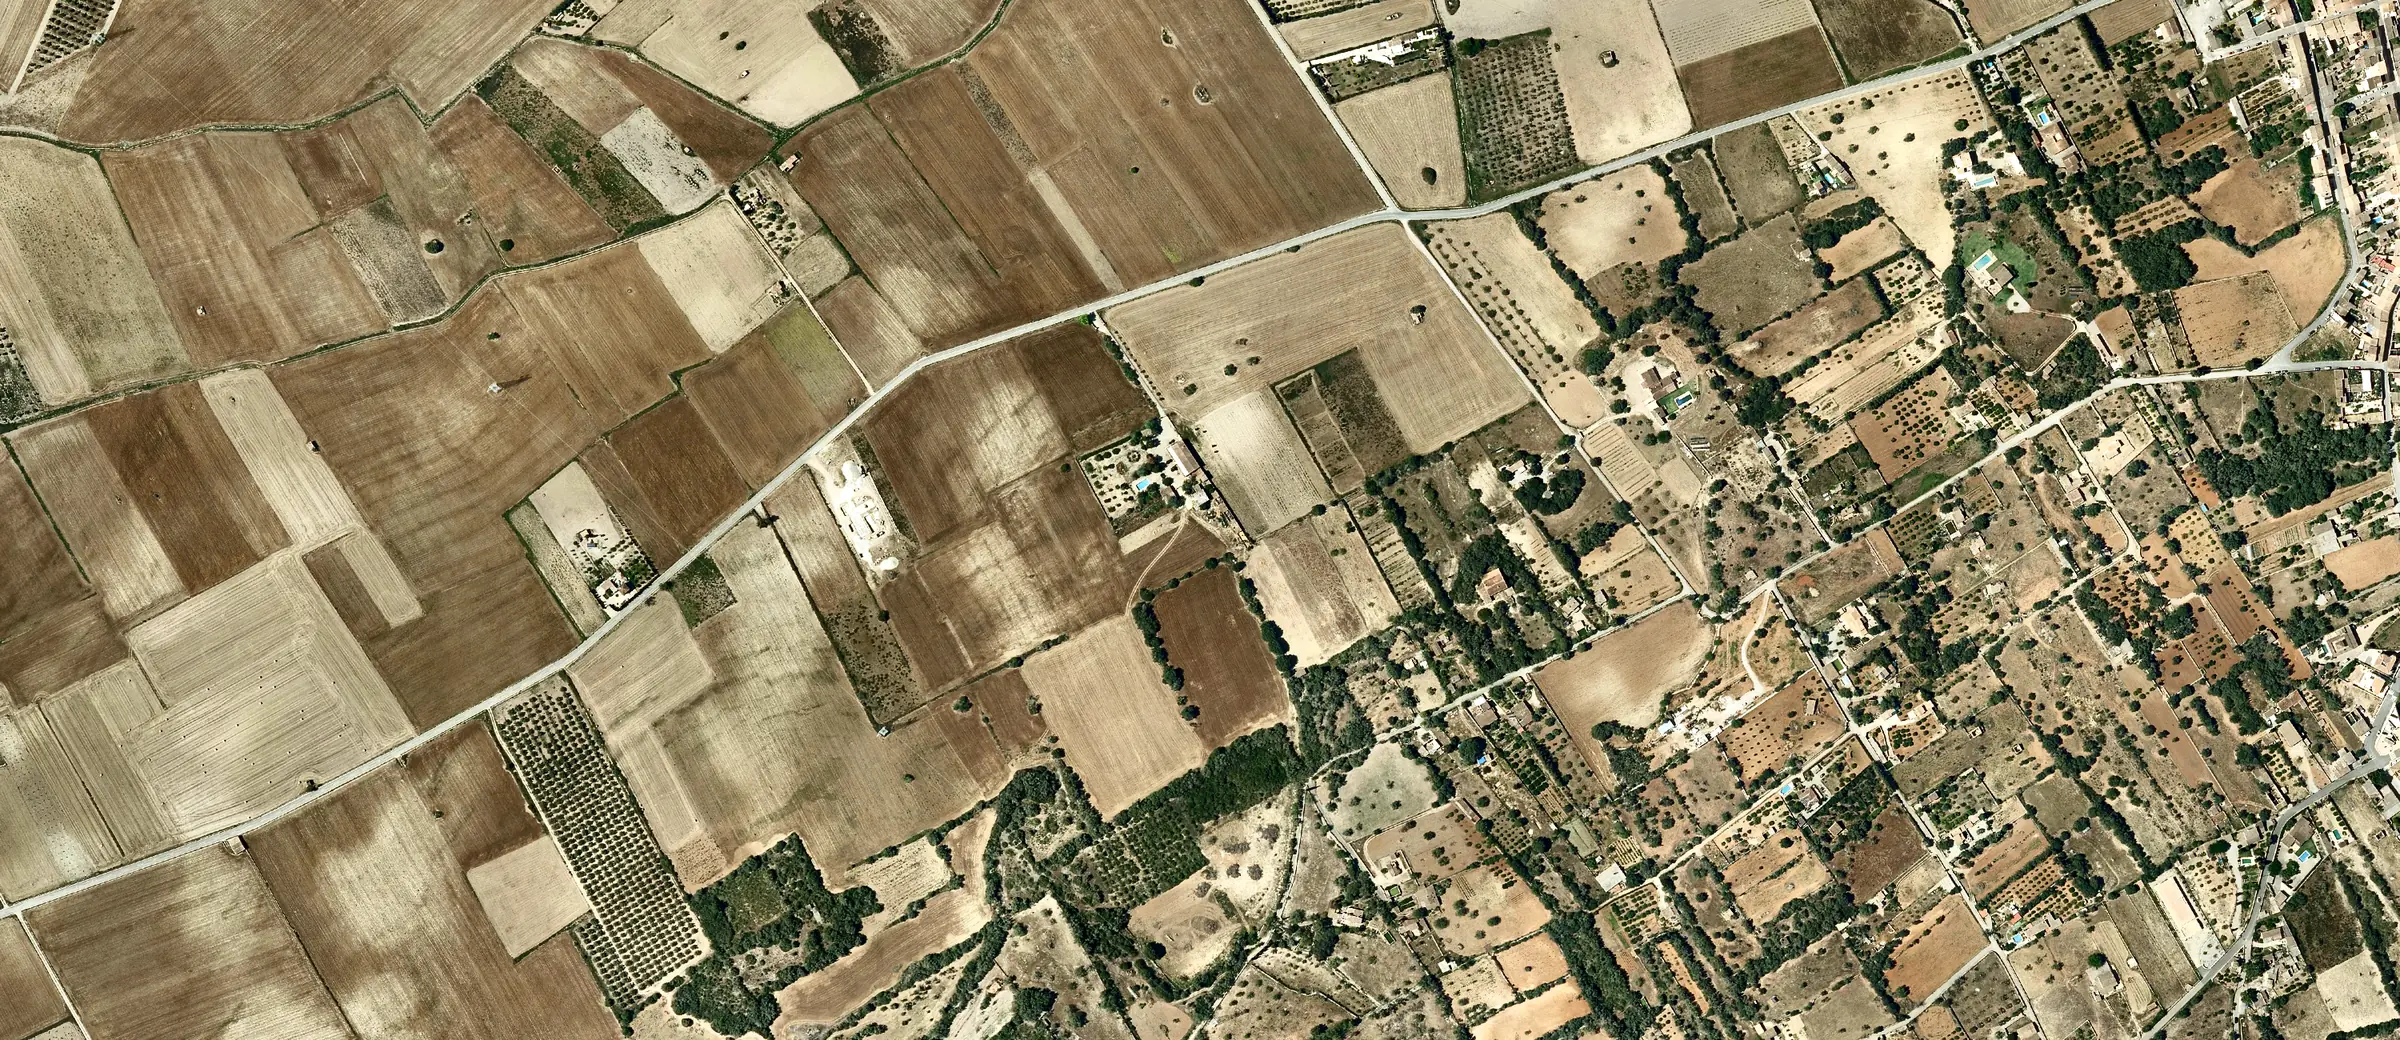
PNOA orthophoto courtesy of © Instituto Geográfico Nacional